Signi-Trend: Detecting Significant Trends in Text
Details on this method will be published as:
SigniTrend: Scalable Detection of Emerging Topics in Textual Streams by Hashed Significance Thresholds
Erich Schubert, Michael Weiler, Hans-Peter Kriegel
20th ACM SIGKDD Conference on Knowledge Discovery and Data Mining
Please attend the KDD 2014 conference
for details.
Electronic Edition (ACM) — preprint — Presentation Recording — Slides.
Available data sets:
News Articles for 2013
This data set is now packed with media events: VIPs going out of jail, dieing from a fatal overdose, a year-long illness, pneumonia, or peacefully at the age of 88, while others were banned from the NBA. A girl threw a shovel in a catfight, mercer upset duke in the march madness, there was a blood moon, earthquakes in chile and los angeles. We are also missing an airplane and a bearded woman won the Eurovision song contest. It's all in there: brit awards, the Oscars, soccer, game of thrones, april fools, pi day (03/14) and a little bit of spam ("#votekatniss") our primitive filters did not yet catch.
StackOverflow
News Articles for 2014
Documentation:
(The final version of the article is not yet available - please attend the KDD conference!)Basics: Moving Averages and Variances
The basic approach used is to use exponentially weighted moving averages (EWMA) to model the expected number of occurrences. In order to rate how significant a trend is, we also model the variance in pretty much the same way (be careful to have a good numerical precision).
Of course there are some tiny bits to calibrate: the first occurrence of a term would have "infinite" significance. Therefore, we need to assume some background noise or thresholds to bias our results to only capture trends that both have substantial volume and significance.
Basics: Preprocessing
As usual with text mining, we had to do a lot of preprocessing - too much to give all the details here; but it is all average textbook stuff.
In particular, we performed stemming to merge different versions of the same word (i.e. explosion, explodes, explode all become "explos") removed stopwords (words such as "the") and for the Twitter data set, we also ignored all retweets (which require little user activity and add little value for our analysis) and near-duplicate tweets (which are very often Spam tweets).
We did not yet use actual NLP techniques such as entity extraction. We are convinced this will further improve the results, but we did not yet have the time to try this.
Contribution: Co-occurrence for Detecting Complex Events
Looking at a single word may be not enough. Certain words occur all the time.
This is probably best explained by the "Boston Marathon Explosion" example: each of these words occurs a lot. In Boston, there is always something newsworthy happening. And in financial data, things also like to explode: markets explode, shares explode, prices explode ... and of course, people like to run marathons all over the world.
In order to detect interesting events, it may be necessary to look at more than one word at a time: the combination "boston" and "marathon" was much rare; "marathon" and "explosion" did not occur in the data at all prior to the attack! For most events, there will be such a combination of words that is nearly unique. And while there are many Georges and many bushes, the combination is also much more specific.
If you inspect our data set, you can find that boston and explosion achieved a significance of about 9, whereas explosion only obtained a score of 4.
Contribution: Scalability via Hashing - Heavy Hitters Style
To be able to scale this approach to "Big Data", we implemented a hashing-based approximation strategy. Our approach is heavily inspired by heavy hitter algorithms, which have low precision at rare elements, but next to no error on frequent terms. Except that we do not only track counts - as we are not interested in the most frequent terms - but also their variance. This way, we can detect trending terms efficiently, with constant memory usage.
A key contribution of our work is to go beyond the most frequent items, and instead track those terms who show a substantial increase in their usage.
Hash table sizing: if the hash table were too small, we will lose precision, and may miss low-magnitude trends. If we make it really big, we need a lot of memory and runtime. But it turned out that a fairly moderate size works for all our data sets.
Visualization: Word Cloud
The word cloud in the bottom half is much smarter than regular word clouds: the different colors indicate clusters, and words that trend together are connected by lines.
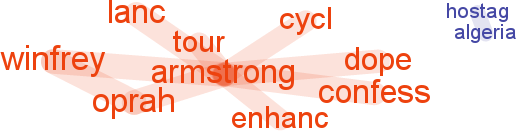
One could probably write a separate paper on how to construct such a word cloud - cooccurrence and Jaccard similarity are used for clustering and similarity measurement. The data is then projected into two dimensions using multidimensional scaling, and a force directed graph is used to prevent words from overlapping too much.
So far, this is heuristic and more a fun visualization feature than an actual contribution of our research, although there seems to be quite some interest in how we did this...
Visualization: Control Chart
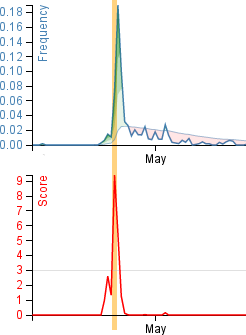
For each trend, you can see a time series chart consisting of two plots. The upper plot visualizes the frequency of this term or term combination. The thick line is the observed frequency, the thin line indicates the moving average, and the colored areas indicate standard deviations.
In the lower plot, the significance of the trend is visualized. Most of the time, this will be 0 - no trend. Significant trends will be much larger than 3 standard deviations, indicated by the grey horizontal line. In this example, we observe a trend with over 9 sigma significance.
The current point in time is indicated by the yellow vertical bar.
Getting the Code (Sorry, not yet available)
Getting the source code useable by others is a work in progress. We plan on making the source code available at some point - just like we did with our data-mining toolkit ELKI - but we are not yet ready for this. We're too busy to building this into a much larger tool, which will become actor-based, and get a lot of the functionality you would expect to have.
Stay tuned. We will really try to make this available to you for experimenting!
Authors
All authors are members of the Database Systems Group at the Ludwig-Maximilians-Universität München, Munich, Germany.
Dr. Erich Schubert recently completed his PhD in outlier detection, and seized this opportunity at widening his research domain to textual data. He is looking for positions to continue his academic career.
Michael Weiler just started his PhD research in the group, and will focus on detecting trends in text; both from streaming searches and as interactive environment.
Prof. Dr. Hans-Peter Kriegel is the head of the group and advisor of both, giving the overall research direction, experience and - most importantly - finding the right people to work together to make the magic happen.